An IEEE VIS 2014 Workshop
Visualization for Predictive Analytics
Sunday, November 9, 2014. Paris, France.
Sunday, November 9, 2014. Paris, France.
To hear about the latest updates on the workshop, please sign up for our mailing list using the form below:
| 14:00-14:15 | Introduction with Adam Perer |
| 14:15-15:00 | Keynote by Vasant Dhar |
| 15:00-15:40 | Technical Paper Session #1: Techniques in Predictive Visualization
|
| 15:40-16:15 | Coffee Break |
| 16:15-16:55 | Technical Paper Session #2: Space, Time, and Prediction
|
| 16:55-17:10 | Position Papers: Open Challenges in Predictive Visualization
|
| 17:10-17:55 | Panel on Open Challenges, with Robert Spence, Michael Gleicher, and Harald Piringer. Moderated by Ross Maciejewski. |
| 17:55-18:00 | Next steps with Enrico Bertini. |
We are excited to announce that Dr. Vasant Dhar will be the keynote speaker at our workshop.
Dr. Vasant Dhar is a Paduano Fellow, Professor, Head of the Information Systems Group, and Director for the Center for Business Analytics at the Stern School of Business at NYU.
Dr. Dhar’s longstanding research has been on building robust automated decision making systems from large databases based on principles and methods from Artificial Intelligence and related disciplines. The emphasis is on predictive modeling, across areas that span financial markets and other domains including economic networks, news, sponsored search markets, and blogs and other user generated content.
Dr. Dhar recently wrote a compelling article on Data Science and Prediction published in Communications of the ACM.
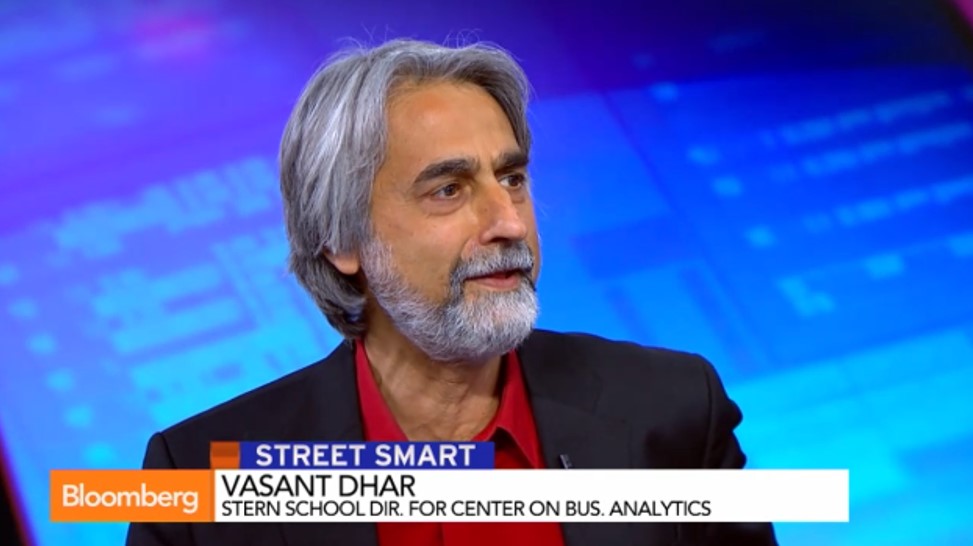
Keynote Speaker: Dr. Vasant Dhar, Professor, Head of the Information Systems Group, and Director for the Center for Business Analytics at the Stern School of Business at NYU.
One of the surprising facts of much current visualization research is that prediction does not often play a significant role. Most visualization research seems to focus exclusively on data analysis and presentation, with little support for predictive analytics and the numerous models researchers have developed for this purpose. Upon reflection, this comes as a surprise as many scientific endeavours and many business problems are mostly concerned with prediction.
Looking more closely at the recent advancements (and tremendous popularity) of Data Science, one may recognize that the vast majority of problems addressed involve some form of prediction and modelling.Notable examples are: prediction of drug effectiveness in drug development, prediction of diseases in healthcare, prediction of crime in city management.

Our goals are to increase the awareness about this interesting opportunity for visualization research, collect and compare examples of existing and ongoing research in this area and to for visual analytics researchers.
The workshop will allow participants to showcase their existing research and ideas and to learn and reflect on the latest advances in visualization of predictive models. To this end, we solicit short technical and position papers.Examples of technical papers include, but are not limited to, the following topics:
Replace the default copyright block found in the TVCG template with:
Proceedings of the 2014 IEEE VIS Workshop on Visualization for Predictive Analytics.
Available online at:  http://predictive-workshop.github.io
Please submit your papers using EasyChair at https://easychair.org/conferences/?conf=vpa2014.
During the submission process, you will be asked to select the appropriate track (Position Papers or Technical Papers).
If you have any difficulties with the submission process, please send an email to predva.workshop AT gmail.com
| Short Papers | September 15, 2014 |
| Notifications | October 10, 2014 |
| Workshop | November 9, 2014 |

Adam Perer is a research scientist at IBM T.J. Watson Research Center. His research focuses on integrating visualization and data mining techniques for making sense of electronic medical records and social networks. He received his Ph.D. in Computer Science from the University of Maryland.
Enrico Bertini is an assistant professor at the NYU School of Engineering. His main research interest is Visual Analytics, with a specific focus on high-dimensional data analysis and the use of visualization in machine learning.
Ross Maciejewski is an assistant professor at Arizona State University. Prior to this, he served as a Visiting Assistant Professor at Purdue University. He received his PhD from Purdue University in Computer Engineering in 2009.

Jimeng Sun is an associate professor at the College of Computing at Georgia Tech. He holds a PhD degree from Carnegie Mellon University. His research focuses on medical informatics, especially in applying large-scale predictive modelling and similarity analytics on biomedical applications.